> For the complete documentation index, see [llms.txt](https://thesis.duarteocarmo.com/llms.txt). Markdown versions of documentation pages are available by appending `.md` to page URLs; this page is available as [Markdown](https://thesis.duarteocarmo.com/new-part/tools-and-data-management.md).
# Tools and data management
In this part of the thesis, some of the more technical high level tools are introduced, these are mainly made of programming languages, libraries and protocols that were essential in reaching the goals for the analysis.
## Data Storage and Retrieval
The first tool that is worth mentioning is the graph database where all of the patents, scientific publications and projects were stored, work developed in the context of the AMICa pathfinder project at DTU. Graph databases are a special type of database that use network structures composed of nodes and edges, to represent and store data. This is opposed to the relational database model where data is separated into different tables. The advantage of “graph databases” lies in the relationships, and the fact that these are explicit.
The database used is managed in [Neo4j](https://neo4j.com/), an open source graph database management system that allows not only to easily run a database server in a machine, but also allows the direct interaction and querying of the data.
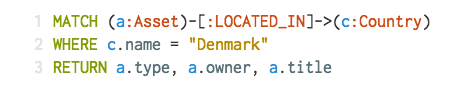
To query the data, Neo4j requires the usage of a programming language know as [Cypher](https://neo4j.com/developer/cypher-query-language/). Cypher can be understood as the graph database equivalent of SQL, and allows for fast relational queries to the data. As a simple example to the cypher language, let us retrieve all of the technological assets located in Denmark:
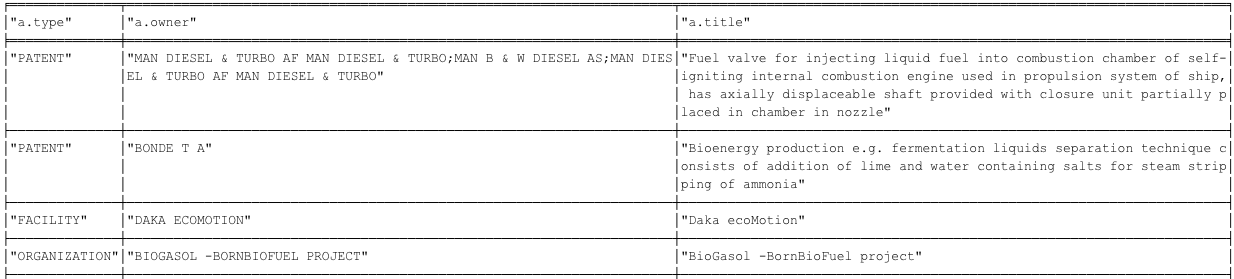
A snippet of the response follows:
## Data Handling and Analysis
The main programming language used to analyze and handle the data was [Python](https://www.python.org/), more particularly its 2.7 version. This was not only because of the familiarity of the author with it but also because of its power and flexibility with data handling.
As a way of interfacing with the Neo4j database, the [py2neo](http://py2neo.org/v4/) open source library was used. This is a particularly convenient way of interacting with the original database through the python environment, since it allows one to write cypher queries directly in the python console and to extract data in a convenient format (numpy matrix, pandas dataframe).
For handling the data, an extensive list of python libraries was used, the most important ones follow:
* [Numpy](http://www.numpy.org/): An essential package for scientific computing that includes a very good matrix object implementation known as the numpy matrix.
* [Pandas](https://pandas.pydata.org/): Provides an easy to read and handle data structure that is especially useful for table visualizations.
* [Math](https://docs.python.org/2/library/math.html): Some mathematical functions are not available out-of-the-box with the python language.
* [Itertools](https://docs.python.org/2/library/itertools.html): A library that allows for efficient looping cycles.
For visualizations, three toolkits were recurrently used:
* [Matplotlib](https://matplotlib.org/): An easy to use tool for producing visualizations such as graphs, bar plots, and others.
* [Seaborn](https://seaborn.pydata.org/): Based on matplotlib, seaborn provides a more visually appealing and statistics focused visualization library.
* [Plotly](https://plot.ly/): Used to create dynamic - web based - visualizations.
If you wish to download a comprehensive list of the libraries used please visit [this](https://gist.github.com/duarteocarmo/ef927631258a8629fab4965c8f031c32) link.
## Code Management and Presentation
To present the data in a narrative format [jupyter](https://jupyter.org/) notebooks. These notebooks constitute an interesting way of presenting not only the code, but also allow a narrative from for the analysis, which is written in markdown. Notebooks are a popular tool in data science and an easy way of presenting data science procedures.
To store the code for the analysis, [GitHub](https://github.com/) was used as a tool for keeping everything in cloud storage. Moreover, by creating a [repository](https://github.com/duarteocarmo/technological_capabilities) for this project, this means that the code is available 24/7 for anyone that wants to consult it or request any modifications.